Rental income and revenue
from rendering of services
Unit: Million THB Revenue from rental and rendering of services
Interest income, Dividend income and Other income
Extra Items
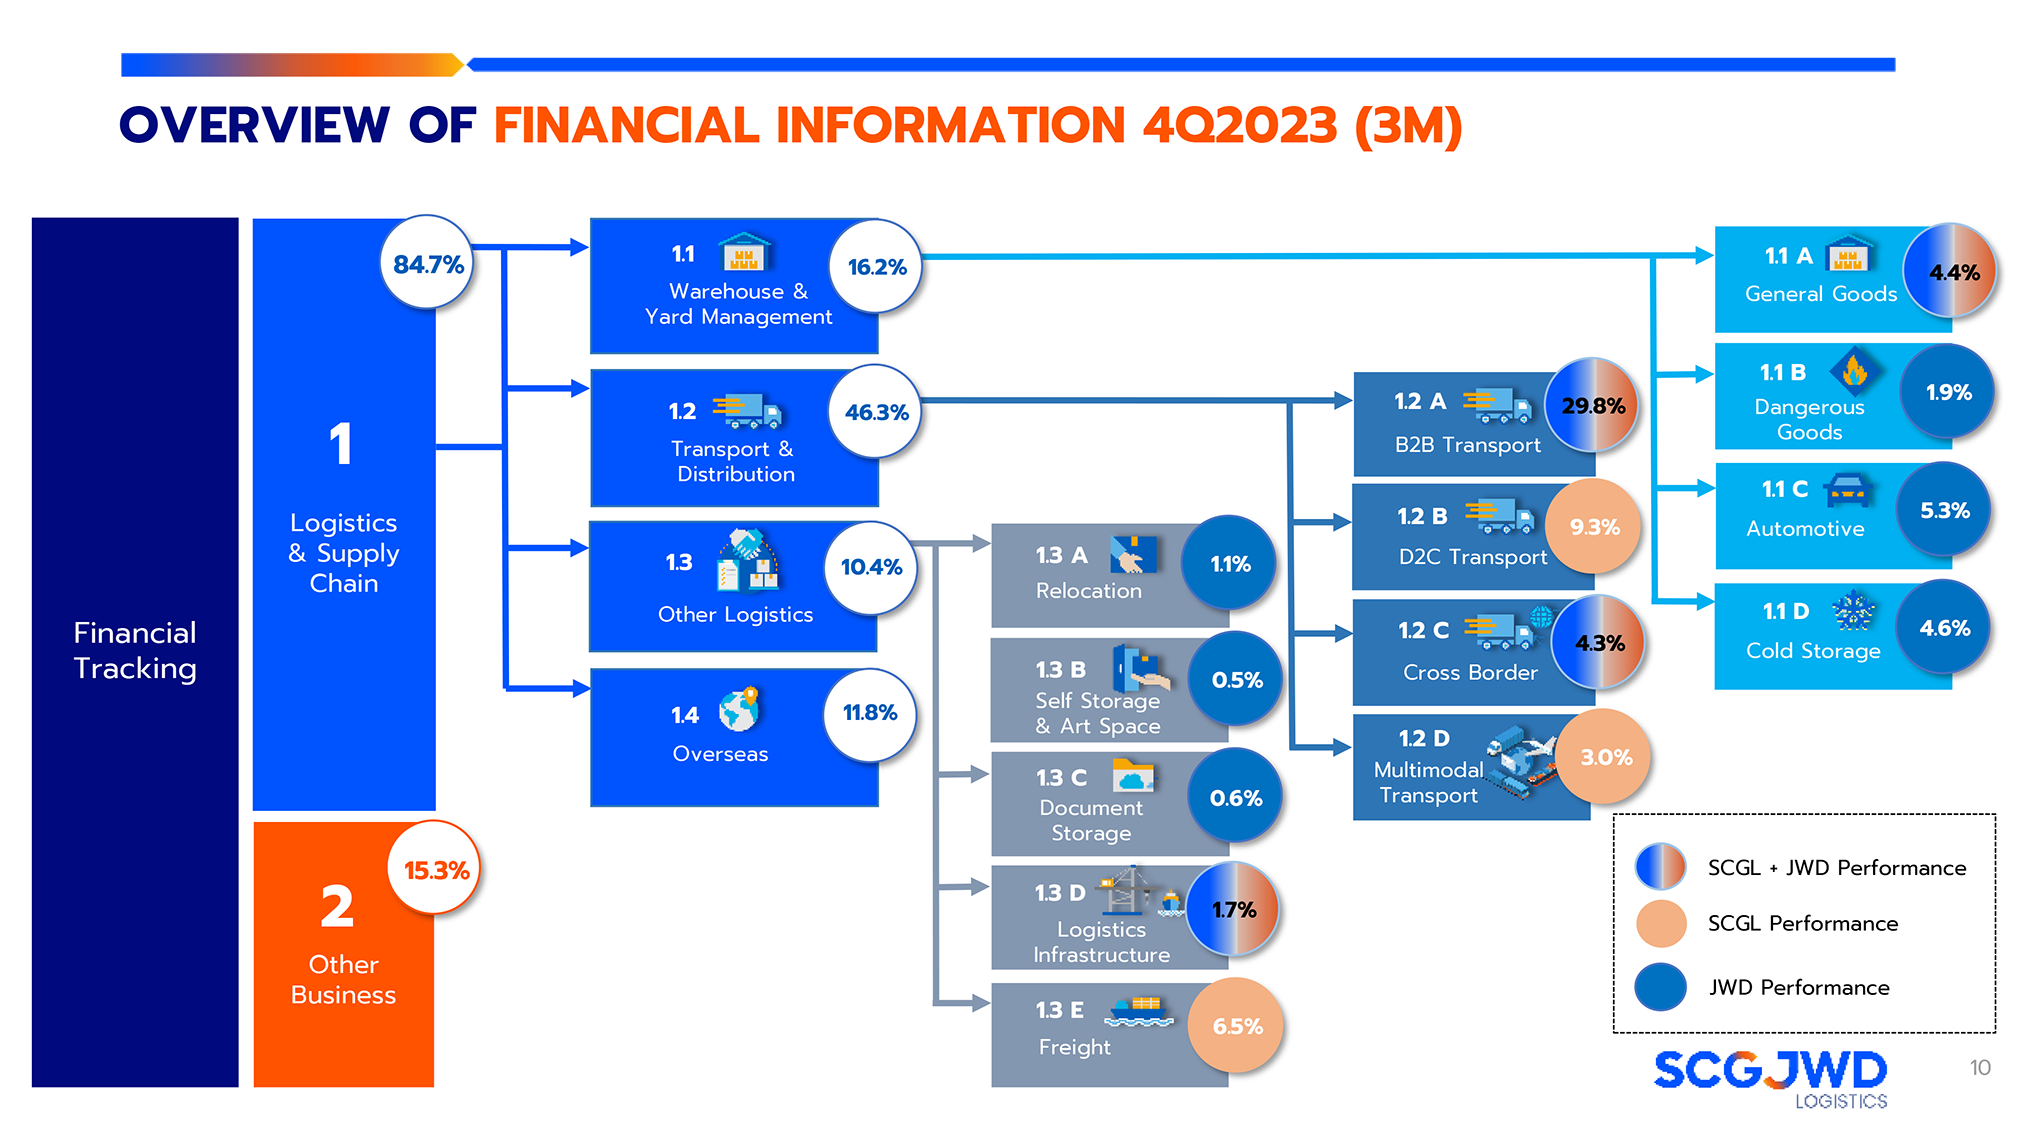
Total Revenue in Q4/2023
Unit: Million THB6378.4
84.7 %
Logistics & Supply Chain
15.3 %
Other Businesses
Assets Liabilities and Equity
Unit: Million THB Assets
Liabilities
Equity
Debt to Equity Ratio
Unit: Times Debt portion from TFRS16
Ratios excluded TFRS16
Unit : Million Baht
| Period as of | 2021 | 2022 | 9M/2023 |
|---|---|---|---|
| Statement of comprehensive income | |||
| Total revenue | 5,293.3 | 5,988.2 | 17,600.6 |
| Revenue from rental and rendering of services | 5,100.9 | 5,902.1 | 17,432.3 |
| Gross profit | 1,219.9 | 1,364.1 | 2,248.8 |
| Selling and administrative expenses | 814.1 | 924.5 | 1,602.8 |
| Net profit* | 571.7 | 504.3 | 500.3 |
| Statement of financial position | |||
| Assets | 12,604.9 | 13,041.3 | 38,868.1 |
| Liabilities | 8,626.5 | 9,606.9 | 16,308.9 |
| Equity | 3,978.4 | 3,434.4 | 22,559.2 |
| Statement of cash flows | |||
| Cash flows from / (used in) operating activities | 1,074.1 | 1,063.8 | 1,604.5 |
| Cash flows from / (used in) investing activities | -1,866.3 | -1,227.3 | -246.3 |
| Cash flows from / (used in) financing activities | 1,383.2 | -396.8 | 542.2 |
| Key financial ratios | |||
| Current ratio (Times) | 0.9 | 0.6 | 1.36 |
| Gross profit margin (%) | 23.9 | 23.1 | 12.9 |
| Net profit margin* (%) | 10.8 | 8.4 | 2.8 |
| Return on equity (%) | 16.7 | 14.7 | 4.71 |
| Return on assets (%) | 7.4 | 6.7 | 4.53 |
| Debt to equity ratio (Times) | 2.2 | 2.8 | 0.7 |
| Interes bearing debts to equity (Times) | 1.8 | 0.4 | 0.56 |
Remark:
* Net profit attributable to owners of the Company